
| Date | Total Shared IPs | Bad Shared IPs | Total IPs Downtime | Affected Sites |
|---|---|---|---|---|
| 2026-03-30 | - | - | - | - |
| 2026-03-29 | - | - | - | - |
| 2026-03-28 | - | - | - | - |
| 2026-03-27 | - | - | - | - |
| 2026-03-26 | - | - | - | - |
| 2026-03-25 | - | - | - | - |
| 2026-03-24 | - | - | - | - |
| Month | HRANK | # in TOP | Uptime, % | Response, ms | Sites, +(-) | Shared IPs, +(-) |
|---|---|---|---|---|---|---|
| Feb 2026 | N/A | - | N/A | N/A | - | - |
| Jan 2026 | N/A | - | N/A | N/A | - | - |
| Dec 2025 | N/A | - | N/A | N/A | - | - |
| Nov 2025 | N/A | - | N/A | N/A | - | - |
| Oct 2025 | N/A | - | N/A | N/A | - | - |
| Sep 2025 | N/A | - | N/A | N/A | - | - |
| Year | HRANK | # in TOP | Uptime, % | Response, ms | Sites, +(-) | Shared IPs, +(-) |
|---|---|---|---|---|---|---|
| 2018 | 3.8 | 157 | 99.334 | 1276 | -104 | +1 |
| 2019 | 4.1 | 185 | 99.311 | 1059 | -60 | -1 |
| 2020 | 4.2 | 142 | 99.423 | 1004 | +445 | 0 |
| 2021 | 4.1 | 146 | 99.266 | 1080 | -277 | +1 |
| 2022 | 5.6 | 116 | 99.848 | 893 | -1,762 | -6 |
| 2023 | 6.3 | 73 | 99.878 | 920 | -235 | +2 |
| 2024 | N/A | - | N/A | N/A | - | - |
MyTrueHost.com Review
visit provider
Background
Business Name: MyTruehost.com, Inc.
Year of foundation: 2011
Location: Pittsburgh, Pennsylvania, UK
BBB Accreditation: No
Market Size: > 2K websites (#98 in HRank list)
Growth Status: (by websites quantity): Decreasing
MyTrueHost.com is a well-known and large international hosting company started in 2011 and since that time it became more popular.
They are located in Pittsburgh, the USA, with their servers in Florida. The company has customers from all over the world – USA, UK, Canada, India, and other countries.
There are various reviews about the company online, however, very little information to be found about the history of the company and their way. According to web.archive.org, they changed their website design only last year. The older versions of the website haven’t added much to their story either.
Offers and Pricing
| Name | Domains | Disk | Bandwidth | Min Price | Billing Term |
|---|---|---|---|---|---|
| Bronze | 1 | Unlim | Unlim | $0.92 | 24 Mo |
| Silver | 5 | Unlim | Unlim | $3 | 1 Mo |
| Gold | 26 | Unlim | Unlim | $5 | 1 Mo |
| Platinum | Unlim | Unlim | Unlim | $7 | 1 Mo |
Their prices start from $1, which is quite cheap, so clients like it. However, it is possible to choose plans according to any requirements.
There are 4 shared plans altogether and, in fact, they all cost the same in terms of monthly prices: $1/mo, $3/mo, $5/mo, and $7/mo regardless of whether you pay monthly, annually, biannually or triennially. In the table above you can see the cheapest options; in case of the
Despite the low price, they guarantee 99.9% uptime, the quality of their product and 30-days money back.
We didn’t expect to find so opposite reviews about MyTrueHost on the Internet. We have some experience with this company and we haven’t noticed any specific faults from their side.
Support
Instant Technical Live Support: Yes
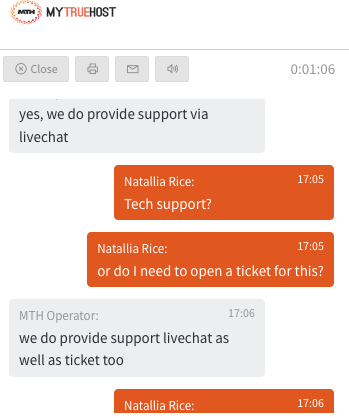
MyTrueHost provides good quality service and also prompt support. Its support team can be reached by emails, a phone number, and a live chat.
As far as we checked, their tech support answers promptly.
MyTrueHost Summary Analysis by HRank
MyTrueHost finished 2018 with 3.8 HRank and appeared in the 157th position. 2018 was finished with 4.1 HRank and 185th position.
A lot of downtimes were detected by our robot in the course of the monitoring in 2018/19. Thus, the provider can be characterized as very unstable.
And also very slow: the average response time from the domains on Shared IPs was about 1,200ms – 1,500ms. We definitely haven’t expected such poor performance on the provider’s part.
2018/2019 showed almost the same number of websites.

